Although I have not been posting much to this site recently, I have been busy working on my research. Most of my attention has been on a new book project tentatively entitled Dirty Bits: An Environmental History of Computing. This is a project that explores the intersection of the digital economy and the material world, from the geopolitics of minerals (lithium, cobalt, etc.) to e-waste disposal to the energy and water requirements associated with the misleadingly named “Cloud.”
But I have been continuing to work on the history of computer programming as well. My most recent article is on the history of flowcharts, which were (and to a certain extent, still are) an essential element of the process of programming. For the most of past century, learning to flowchart a problem was the first step in learning to program a computer. And yet flowcharts were rarely useful as the “blueprints” of software architecture that they were often claimed to be. Their function was much more complicated and ambiguous —although none the less useful.
In the latest issue of the journal Information & Culture, I explore the “Multiple Meanings of the Flowchart”. For those of you without access to the Project Muse academic database, you can find an earlier draft version of the paper for free online here.
Here is a brief excerpt from the introduction:
In the September 1963 issue of the data processing journal *Datamation* there appeared a curious little four-page supplement entitled “The Programmer’s Coloring Book.” This rare but delightful bit of period computer industry whimsy is full of self-deprecating (and extremely “in”) cartoons about working life of computer programmers. For example, “See the program bug. He is our friend!! Color him swell. He gives us job security.” Some of these jokes are a little dated, but most hold up surprisingly well.
One of the most insightful and revealing of “The Programmer’s Coloring Book” cartoons is also one of the most minimalistic. The drawing is of a simple program flowchart accompanied by a short and seemingly straightforward caption: “This is a flowchart. It is usually wrong.”
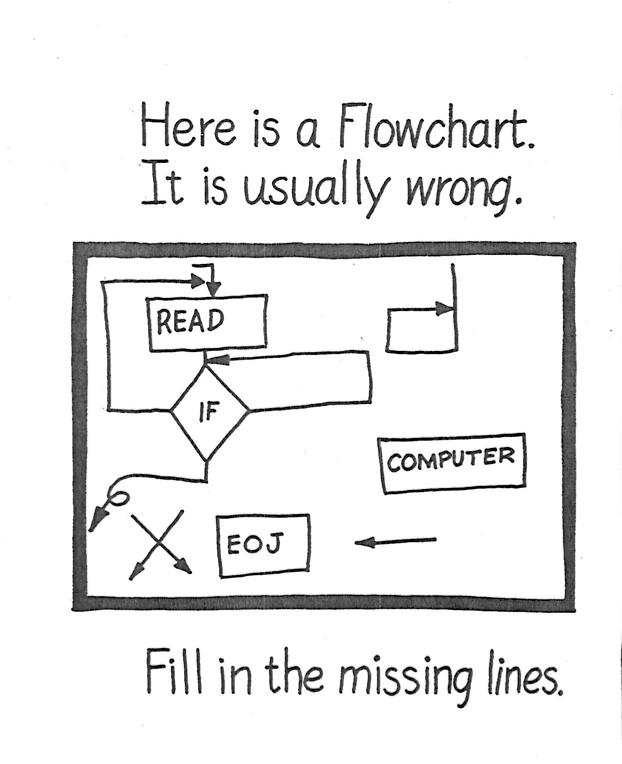
In case you don’t get the joke, here is some context: by the early 1960s, the flowchart was well-established as an essential element of any large-scale software development project. Originally introduced into computing by John von Neumann in the mid-1940s, flowcharts were a schematic representation of the logical structure of a computer program. The idea was that an analyst would examine a problem, design an algorithmic solution, and outline that algorithm in the form of a flowchart diagram. A programmer (or “coder”) would then translate that flowchart into the machine language understood by the computer. The expectation was that the flowchart would serve as the design schematic for the program code ( in the literature from this period flowcharts were widely referred to as the “programmer’s blueprint”) with the assumption was that once this “blueprint” had been developed, “the actual coding of the computer program is rather routine.”
For contemporary audiences, the centrality of the flowchart to software development would have been self-evident. Every programmer in this period would have learned how to flowchart. In the same year that the “Programmer’s Coloring Book” was published, the American Standards Association had approved a standardized flowchart symbol vocabulary. Shortly thereafter, the inclusion of flowcharting instruction in introductory programming courses had been mandated by the Association for Computing Machinery’s influential Curriculum ’68 guidelines. A 1969 IBM introduction to data processing referred to flowcharts as “an all-purpose tool” for software development and noted that “the programmer uses flowcharting in and through every part of his task.” By the early 1970s, the conventional wisdom was that “developing a program flowchart is a necessary first step in the preparation of a computer program.”
But every programmer in this period also knew that although drawing and maintaining an accurate flowchart was what programmers were *supposed* to do, this is rarely what happened in actual practice. Most programmers preferred not to bother with a flowchart, or produced their flowcharts only after they were done writing code. Many flowcharts were only superficial sketches to begin with, and were rarely updated to reflect the changing reality of a rapidly evolving software system.[@Yohe1974] Many programmers loathed and resented having to draw (and redraw) flowcharts, and the majority did not. Frederick Brooks, in his classic text on software engineering, dismissed the flowchart as an “obsolete nuisance,” “a curse,” and a “space hogging exercise in drafting.” Wayne LeBlanc lamented that despite the best efforts of programmers to “communicate the logic of routines in a more understandable form than computer language by writing flowcharts,” many flowcharts “more closely resemble confusing road maps than the easily understood pictorial representations they should be.” Donald Knuth argued that not only were flowcharts time-consuming to create and expensive to maintain, but that they were generally rendered obsolete almost immediately. In any active software development effort, he argued, “any resemblance between our flow charts and the present program is purely coincidental.”[@Knuth:1963fg]
All of these critiques are, of course, the basis of the humor in the *Datamation* cartoon: as every programmer knew well, although in theory the flowchart was meant to serve as a design document, in practice they often served only as post-facto justification. Frederick Brooks denied that he had ever known “an experienced programmer who routinely made detailed flow charts before beginning to write programs,” suggesting that “where organization standards require flow charts, these are almost invariably done after the fact.” And in fact, one of the first commercial software packages, Applied Data Research’s Autoflow, was designed specifically to reverse-engineer a flowchart “specification” from already-written program code. In other words, the implementation of many software systems actually preceded their own design! This indeed is a wonderful joke, or at the very least, a paradox. As Marty Goetz, the inventor of Autoflow recalled “like most strong programmers, I never flowcharted; I just wrote the program.” For Goetz, among others, the flowchart was nothing more than a collective fiction: a requirement driven by the managerial need for control, having nothing to do with the actual design or construction of software. The construction of the flowchart could thus be safely left to the machine, since no-one was really interested in reading them in the first place. Indeed, the expert consensus on flowcharts seemed to accord with the popular wisdom captured by the “Programmer’s Coloring Book”: there were such things as flowcharts, and they were generally wrong.
 Follow